Post
EVENT REPORT | London's Alternative Maps
4 Apr 2022
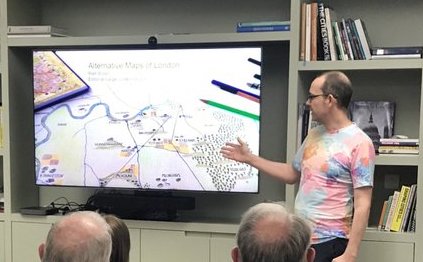
Matt Brown, author of the recently award-winning 'Atlas of Imagined Places' and editor-at-large of The Londonist, gave a recent sell out talk to the Society in the Ing Media offices. Josh Fenton reports.
Matt, who has spent 20 years thinking and writing about London, started his talk with the following idea: anything you can do with words and pictures, you can do with maps. During the presentation, we saw how true that was.
The maps we saw were indeed ‘alternative’ - not strictly orthographic or designed to be used for navigation, but they were all informed and enriched by a nuanced understanding of what makes places meaningful. To begin, Matt took us through some of the most well-known maps of London, including London from the 1740s, by John Rocque and the London Underground Map. Then, there were a series of maps with overlays, including the maps drawn up by Charles Booth and his team whilst studying London's social disparities.
Other maps had even more layers, for example, those created online by Matt to represent the location of the V2 bombs that fell in London and highlight the stories of those who were affected. The map is very much a ‘living’ document still growing as more people add in their stories and connect with long lost friends and relatives. Following on from the successes of his war damage maps, Matt hopes to use mapping to put more emphasis on the stories beneath our feet, like, munitions explosions, train crashes and other devastating events.
Though Matt admits that Google maps can be clunky, it’s an ideal rough and ready medium to collate ideas, especially during a bout of insomnia! Matt has also mapped Dickens' novels and the places and streets that colour the narrative.
With a nod to the previous presentation on Unbuilt London, we looked at 1930s diagrammatic maps which showed plans for a Grand Central Heliport and hard standing covering over a drained Thames River. Winding back further, but still using our imagination, we saw a visualisation of what ‘London’, or Lundenwic as it would have been known, might have looked like in 500 to 1000AD. Odd-looking place names gave a sense of how each of London’s villages would have emerged; Camberwelle, Pecheham, Wember Lee, Totten Heale.
Then leaping forward to modern, more artistic maps were shown which question and narrate how London fits together. As well as the Bear tube map, we saw Roman and Tudor London reimagined with their own tube networks. Matt wanted us to broaden our horizons of what maps could be, sharing his book Atlas of Imagined Places and another which is soon to be released - featuring a similar retelling of London. The Atlas draws on the shared fictional influences and understandings of place, bringing in references from the big and small screens as well as manga and video games even bringing in eminent figures like Thomas The Tank Engine and his home island of Sodor.
When questions were invited from the audience, some wanted to immediately settle it once and for all: when is a map a map, and when is it a diagram? Matt wouldn't be drawn on that matter. On the more serious side of things, the question was put forward, can maps be used to solve some of the bigger issues we face today? Migration for example, or the global refugee crisis? Matt observed that there are many projects ongoing looking at exactly these things, but they tend to run into issues at a certain scale. For it to work, he believes that bigger players like Google would need to play a role. In terms of serious analysis, Information Capital by Oliver Uberti and James Cheshire was one example of alternative mapping put to work on big issues. The writers used real-world data from the streets of London and visualise it in a way that makes evident the stark contrasts.
An audience member asked what the future of maps might look like in a world where AR and VR become normalised? Matt pointed out that Google Street Viewer already allows us to go back in time, but, the new tech could make it possible for us to step back further still. By making use of paintings or sketches from history we could walk the streets of Whitechapel 300 years ago. Or through the use of our imagination perhaps take a stroll 300 years into the future?
When data is added to the image scrolling through VR goggles, all in attendance agreed that could be quite interesting, visualising the effects of social deprivation, traffic speed and intensity and other similar data points in real-time. What are the impacts this could have on planning and urban development? Or, in the case of looking back and deploying the data from Charles Booth's studies of London, what could it do for education? Whatever the answers to these two final questions, it's clear that maps not only hold the keys to understanding our past but also our future.